Explore React
Chart & Graph Components
React
Charts & Graphs
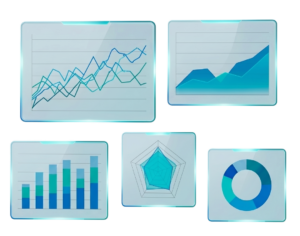
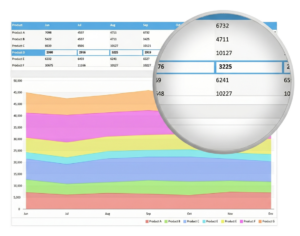
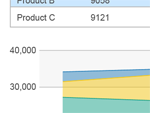
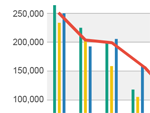
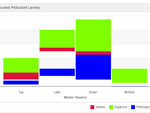
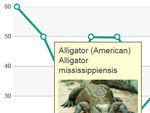
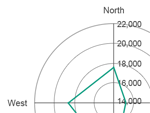
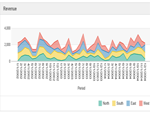
SmartClient provides dynamic, high-performance chart components for React.
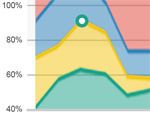
- Area, column, radar & numerous other graph types
- Update data, position and facets on the fly
- Export and share PDF reports with grids and charts

Explore React
Chart & Graph Components
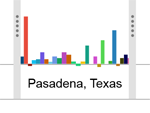
Ad-hoc Data Visualization
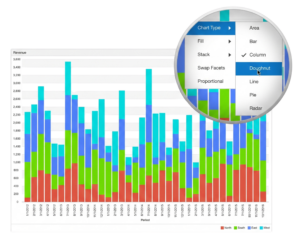
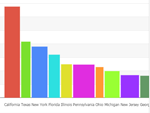
Users can reconfigure charts on-the-fly to produce the best visualization.
- Switch chart type on the fly to explore data
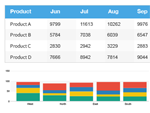
- Pivot datasets / swap axes, stack and unstack
- Visualize data without a pre-designed chart

Explore React
Chart & Graph Components
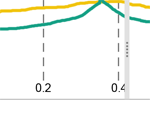
Complex Data Visualization
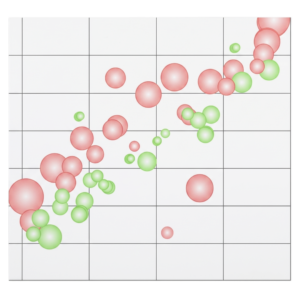
Simple, insightful representations of complex data in React.
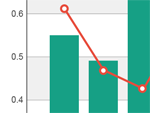
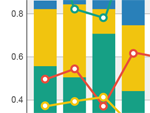
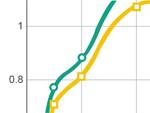
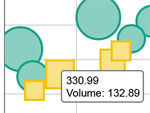
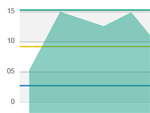
- Multiple (3+) axis, multi-series charts
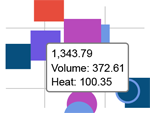
- Visualize up to 4 metrics with bubble & color scales
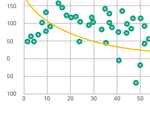
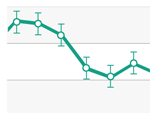
- Regression curves, error bars and more

Explore React
Chart & Graph Components
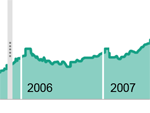
Zoom In and Out
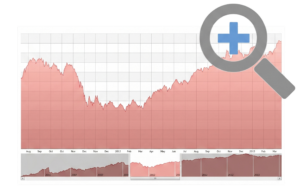
Get right to the point with the SmartClient Platform.
- Narrow in on a range of data to view in detail
- Drag set range boundaries to focus on other areas
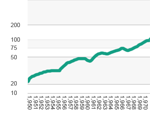
- Intelligent axis labels change as you zoom

Explore React
Chart & Graph Components
Easily Connect to Data
The SmartClient Platform makes building really hard things simple.
- Simple to generate a chart from any grid
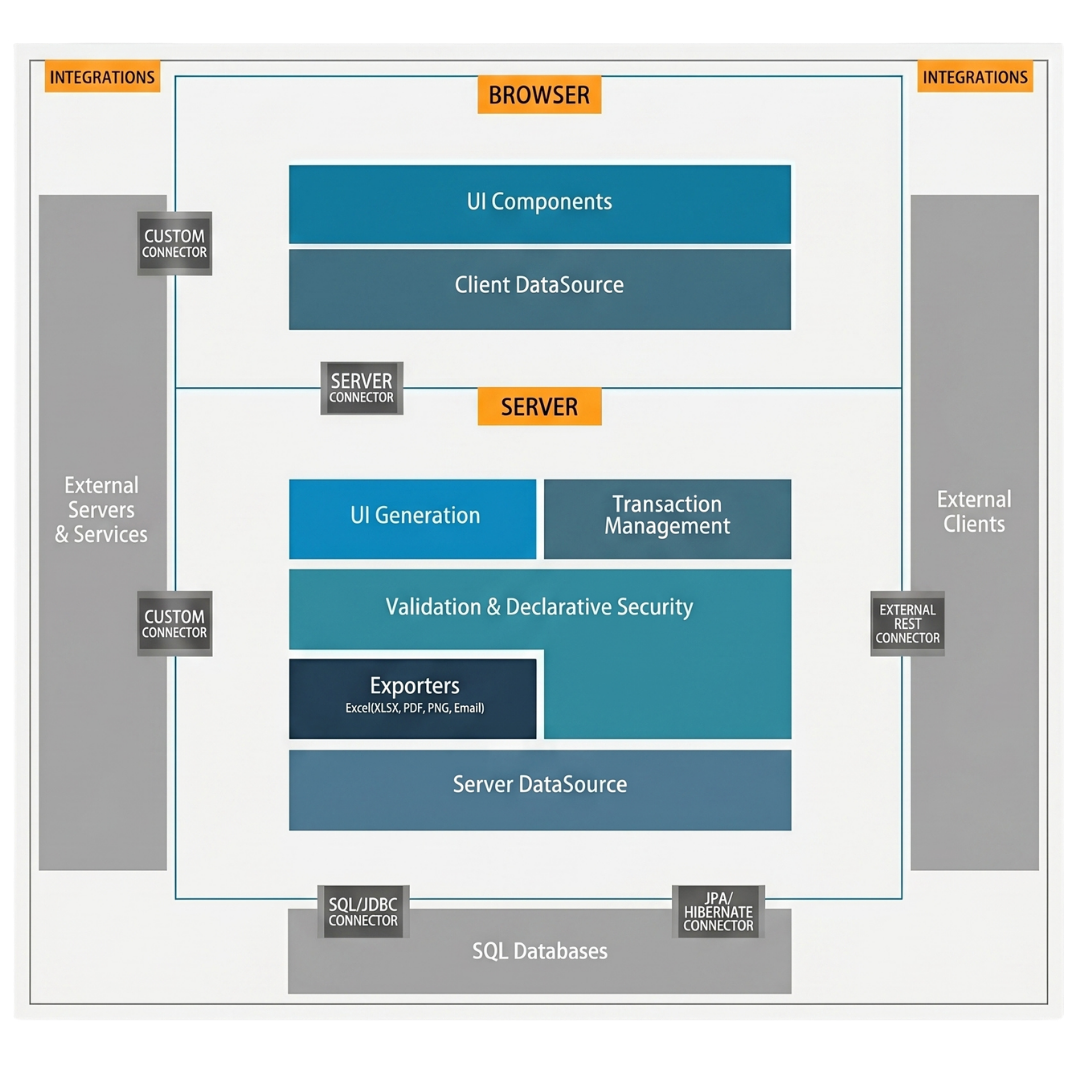
- Easily bind to SQL, Hibernate, JPA, REST & WSDL services
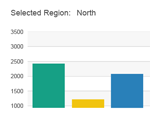
- React to user edits & connect to real-time streaming data

Explore React
Chart & Graph Components
More than Just Charts
SmartClient provides a platform for building your own interactive visualizations.
- More than just charts, a complete framework for HTML5 web applications
- Combine charts with grids, sliders, menus and other advanced widgets
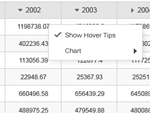
- Extend charts with drag & drop interactions,
custom hovers & more

SmartClient provides the most advanced and complete component set for your React application.
Add any Chart component into your React Application.
(Click any chart to see a live, interactive sample in our showcase)