Skip to content
  • Overview
    • Basics
    • Advantages
    • AI Capabilities
    • Our Customers
    • Hands-on Demo
  • Products
    • Smart GWT
    • SmartClient
    • Reify
    • AI
    • Editions & Pricing
    • Documentation
    • Downloads
  • AI
    • Answer Engine
    • AI Assist
    • AI-Enhanced Components
    • Reify AI
    • AI Report Builder
    • Instant UI
  • Services
    • Support
    • Training
    • Consulting
    • Feature Sponsorship
    • Jump Start
  • Solutions
    • Drug Discovery
    • Financial Analysis
    • Medical Research
    • Insurance Claims Processing
  • Contact
  • Company
    • About
    • Careers
    • Blog
    • Contact Us
  • Forums
    • SmartClient Forums
    • Smart GWT Forums
    • Community Wiki
  • REGISTER
    • REGISTER
    • LOGIN
  • Overview
    • Basics
    • Advantages
    • AI Capabilities
    • Our Customers
    • Hands-on Demo
  • Products
    • Smart GWT
    • SmartClient
    • Reify
    • AI
    • Editions & Pricing
    • Documentation
    • Downloads
  • AI
    • Answer Engine
    • AI Assist
    • AI-Enhanced Components
    • Reify AI
    • AI Report Builder
    • Instant UI
  • Services
    • Support
    • Training
    • Consulting
    • Feature Sponsorship
    • Jump Start
  • Solutions
    • Drug Discovery
    • Financial Analysis
    • Medical Research
    • Insurance Claims Processing
  • Contact
  • Company
    • About
    • Careers
    • Blog
    • Contact Us
  • Forums
    • SmartClient Forums
    • Smart GWT Forums
    • Community Wiki
  • REGISTER
    • REGISTER
    • LOGIN

Explore React
Chart & Graph Components

Charts & Graphs
Ad-hoc Analysis
Complex Data
Zoom Charts
Data Binding
Framework

React
Charts & Graphs

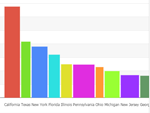
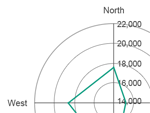
SmartClient provides dynamic, high-performance chart components for React.

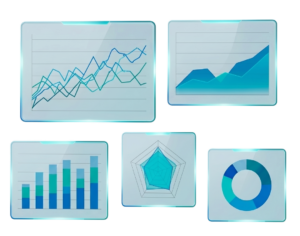
  • Area, column, radar & numerous other graph types
  • Update data, position and facets on the fly
  • Export and share PDF reports with grids and charts
Live Hands on Demo
Learn to use SmartClient with React

Explore React
Chart & Graph Components

Charts & Graphs
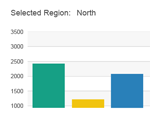
Ad-hoc Analysis
Complex Data
Zoom Charts
Data Binding
Framework

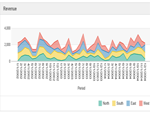
Ad-hoc Data Visualization

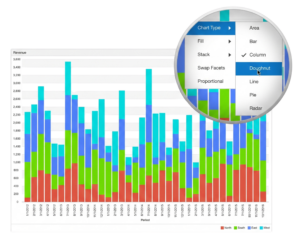
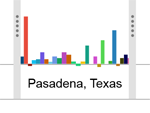
Users can reconfigure charts on-the-fly to produce the best visualization.

  • Switch chart type on the fly to explore data
  • Pivot datasets / swap axes, stack and unstack
  • Visualize data without a pre-designed chart
Live Hands on Demo
Learn to use SmartClient with React

Explore React
Chart & Graph Components

Charts & Graphs
Ad-hoc Analysis
Complex Data
Zoom Charts
Data Binding
Framework

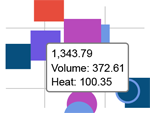
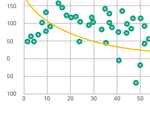
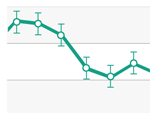
Complex Data Visualization

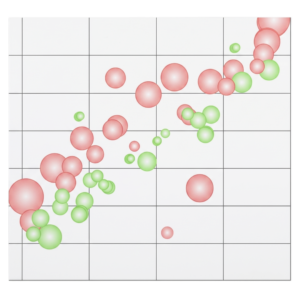
Simple, insightful representations of complex data in React.

  • Multiple (3+) axis, multi-series charts
  • Visualize up to 4 metrics with bubble & color scales
  • Regression curves, error bars and more
Live Hands on Demo
Learn to use SmartClient with React

Explore React
Chart & Graph Components

Charts & Graphs
Ad-hoc Analysis
Complex Data
Zoom Charts
Data Binding
Framework

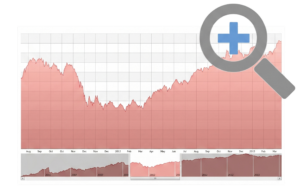
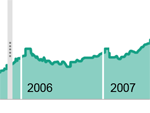
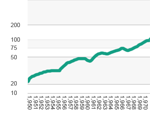
Zoom In and Out

Get right to the point with the SmartClient Platform.

  • Narrow in on a range of data to view in detail
  • Drag set range boundaries to focus on other areas
  • Intelligent axis labels change as you zoom
Live Hands on Demo
Learn to use SmartClient with React

Explore React
Chart & Graph Components

Charts & Graphs
Ad-hoc Analysis
Complex Data
Zoom Charts
Data Binding
Framework

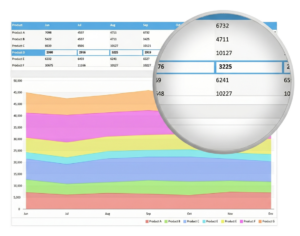
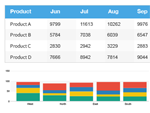
Easily Connect to Data

The SmartClient Platform makes building really hard things simple.

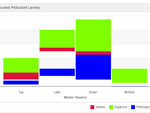
  • Simple to generate a chart from any grid
  • Easily bind to SQL, Hibernate, JPA, REST & WSDL services
  • React to user edits & connect to real-time streaming data
Live Hands on Demo
Learn to use SmartClient with React

Explore React
Chart & Graph Components

Charts & Graphs
Ad-hoc Analysis
Complex Data
Zoom Charts
Data Binding
Framework

More than Just Charts

SmartClient provides a platform for building your own interactive visualizations.

  • More than just charts, a complete framework for HTML5 web applications
  • Combine charts with grids, sliders, menus and other advanced widgets
  • Extend charts with drag & drop interactions,
    custom hovers & more
Learn More
Learn to use SmartClient with React

SmartClient provides the most advanced and complete component set for your React application.

Intelligent Data Management

Unprecedented Scalability & Responsiveness

Deep Server Integration

Fast, efficient development and maintenance

Built-in Mobile Adaption

Code once for all devices

UI Component Set

Broadest, deepest set of device aware UI Components

Learn to Add SmartClient Components to React

Add any Chart component into your React Application.

(Click any chart to see a live, interactive sample in our showcase)
Simple Chart
Multi-Series Chart
Grid Charting
Dynamic Data
Dual Axis
Multi-Series
3+ Axes
Mixed Plots
Stock Prices
Measurement Data
City Populations
Histogram Chart
Scrolling Chart
Custom Date Ticks
Scatter Plot
Bubble Plot
Color Scale Chart
Curve Fitting
Mean & Deviation
Error Bars
Drill Up/Down
CubeGrid Charting
Log Scaling
Interactive Data Points
Adding Elements
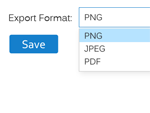
Chart Image Export
Chart PDF Export
Drawing Export
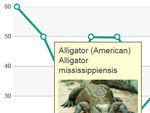
Custom Hovers

Isomorphic Software’s SmartClient includes the most powerful, comprehensive suite of UI components available. These components add unprecedented capabilities to web applications built with React, Vue, Angular, or any other development platform.

Our Pages
  • Technology
  • Customers
  • Contact us
Policies
  • Terms of Use
  • Privacy Policy
  • Cookie Policy
Services
  • Training
  • Support
  • Consulting
  • Documentation
  • Isomorphic Blog
  • Forums
  • Reify
Support
Call Us

(866) 223-4569 (US & Canada)
(415) 222-9902 (International)

Location

Isomorphic Software 1 Sansome Street, Suite 1400 San Francisco, CA 94104, USA

VISIT LIVE SHOWCASE

© 2026 and beyond Isomorphic Software. All Rights Reserved

No thumbnail
Uploaded
Failed
Remove uploaded file